



If you think Princeton’s crashes mainly happen at night or during bad weather, the data show something different.
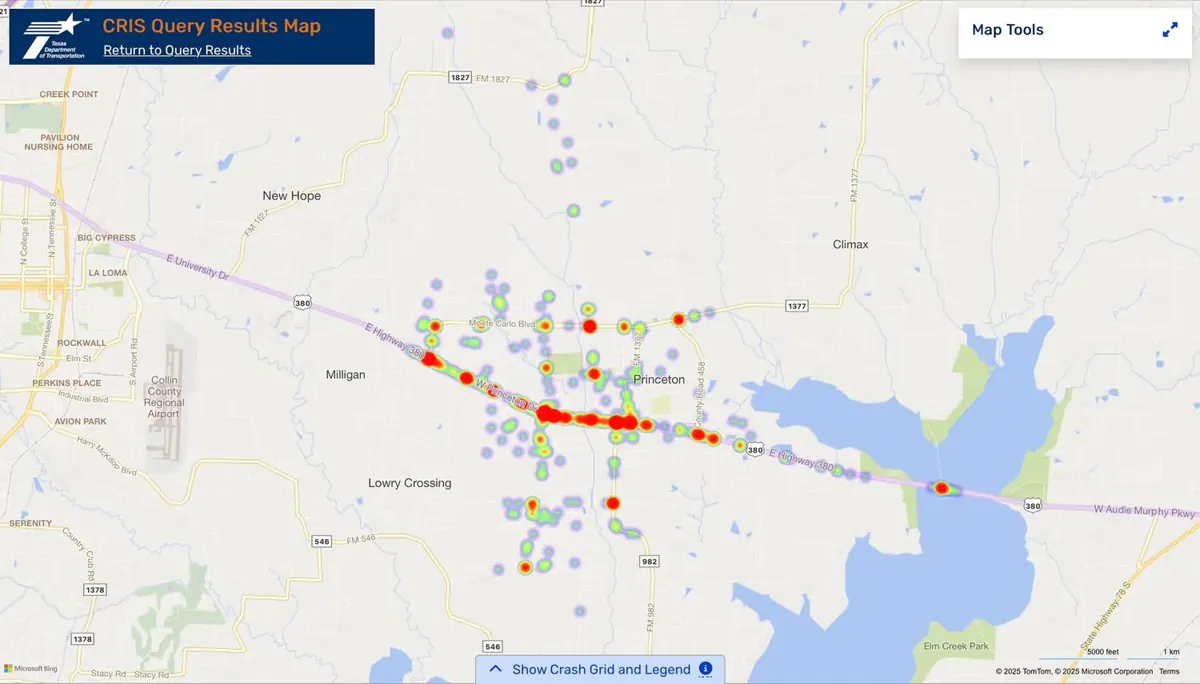
Over the last two years, Princeton recorded 730 crashes, including 4 fatal crashes and 211 crashes involving injuries.
Nearly two-thirds occurred during daylight hours, and more than 80 percent happened in clear weather.
Most crashes took place on dry pavement, and almost 60 percent occurred on roads posted at 45 to 60 miles per hour.
Taken together, the pattern suggests that Princeton’s crash problem is driven less by environmental conditions and more by traffic volume and vehicle speed.
The Raw Numbers
• Total crashes: 730
• Fatal crashes: 4
• Crashes with injuries: 211
• Daylight crashes: 481 (about 66 percent)
• Clear-weather crashes: 609 (about 83 percent)
• Dry-surface crashes: 645 (about 88 percent)
• Crashes on 45 to 60 mph segments: 431 (about 59 percent)
• Crashes on high-volume roads (≈36,460 AADT): 255 (about 35 percent)
That equals roughly 30 crashes per month on average.
Injury Severity
• Fatal: 4
• Serious injuries: 26
• Minor injuries: 93
• Possible injuries: 91
• Not injured: 474
• Unknown: 42
Overall, nearly one in three Princeton crashes results in some level of injury.
Conditions at the Time of Crashes
Lighting conditions
• Daylight: 481
• Dark (lighted): 146
• Dark (unlighted): 71
• Dawn or dusk: 24
Weather
• Clear: 609
• Cloudy: 65
• Rain: 49
Road surface
• Dry: 645
• Wet: 77
Most crashes occur under good visibility and normal road conditions, suggesting driver behavior rather than environmental factors is the primary contributor.
Why This Matters
- Higher speeds on busy corridors can turn minor collisions into incidents requiring emergency response.
- Fire and EMS units may lose availability while responding to crash scenes.
- Insurance costs can rise across a region when injury claims increase.
- Commercial corridors may suffer if drivers begin to perceive them as unsafe.
Why It Keeps Happening
Several structural factors contribute to higher crash risk.
• Road geometry often allows higher cruising speeds due to wide lanes and long sight lines.
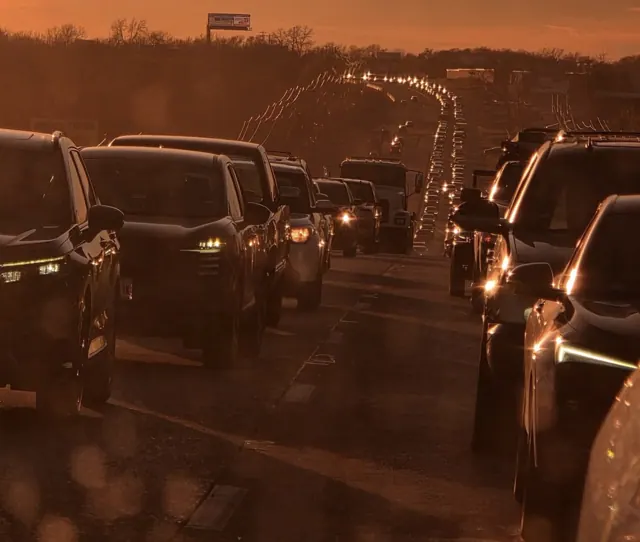
• Rapid population growth pushes more neighborhood traffic onto a limited number of arterial roads.
• Drivers tend to match the speed of surrounding traffic rather than the posted limit.
Potential Next Steps
Possible approaches discussed in transportation planning include:
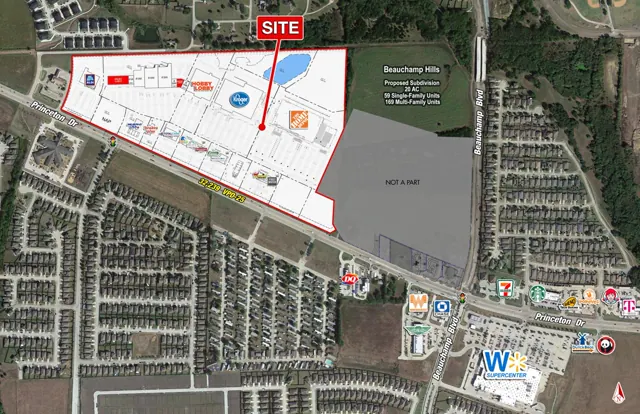
- Setting corridor speed targets and monitoring 85th-percentile speeds on roads such as U.S. 380, Monte Carlo Boulevard, and Beauchamp Boulevard.
- Targeted enforcement windows combined with radar feedback signs.
- Engineering adjustments such as pavement striping, reflectors, or visual lane narrowing to influence driver speed perception.
- Signal timing adjustments to reduce risky turning movements.
- Publishing regular crash summaries to keep residents informed about trends and risk factors.
What Drivers Can Do
Drivers themselves also play a role in reducing risk.
• Follow posted speed limits.
• Maintain safe following distance.
• Avoid distractions such as phone use while driving.
Source
All crash counts are drawn from the Texas Department of Transportation Crash Records Information System (CRIS) using records for:
• City: Princeton
• County: Collin
• Date range: November 2023 through November 2025
Analyzed tables include fatal flags, injury severity, lighting conditions, weather, road surface conditions, posted speed limits, and adjusted daily traffic volumes.